

What is Series Graph?
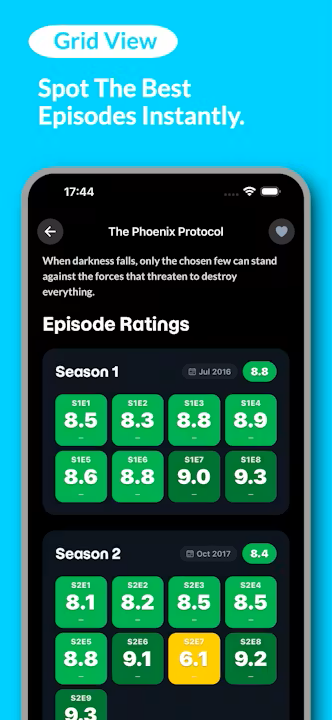
Series Graph is a TV and movie tracking app that turns IMDb ratings into visual episode-by-episode heatmaps, making it easier to see how a series changes over time.
Instead of scrolling through individual ratings manually, you can instantly spot which seasons are strongest, where a show peaks, and which episodes tend to fall off.
The app also includes watch tracking, progress syncing, and streaming availability, all inside a clean interface without ads.
Why people use it
A lot of streaming platforms make discovery feel endless. You start a show without knowing whether it stays good, drops in quality halfway through, or only has a few standout episodes.
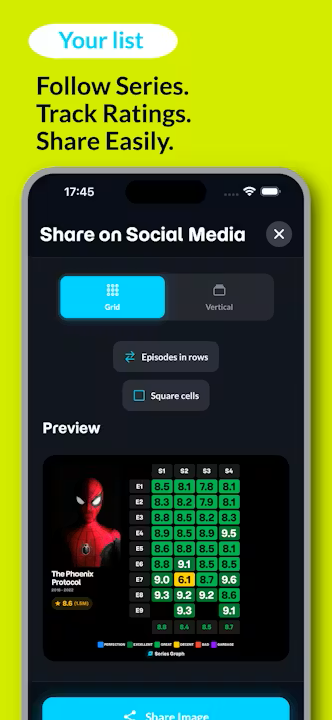
Series Graph makes those patterns visible immediately through visual rating maps.
For long-running shows especially, that makes it much easier to:
- identify highly rated arcs
- skip weaker episodes
- compare seasons quickly
- decide whether a series is worth continuing
What you can track
- Episode and season ratings from IMDb
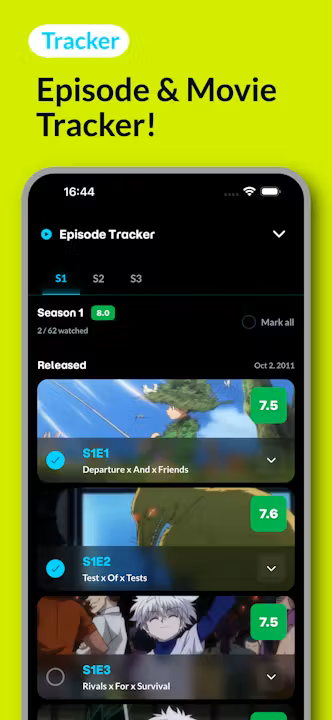
- Watch progress across series
- Completed episodes and movies
- Streaming availability
- Viewing history synced across devices
The heatmap approach is really the core idea behind the product. Instead of treating ratings as isolated numbers, Series Graph turns them into something visual that’s much easier to scan and compare.